Surface Roughness Parameters
Surface roughness parameters in JIS B 0601
- Peaks and valleys in the height direction
- Average amplitude in the height direction
- Average characteristics in the height direction
- Horizontal direction
- Hybrid
- Areal material ratio curve and probability density function
 Search from the parameters list
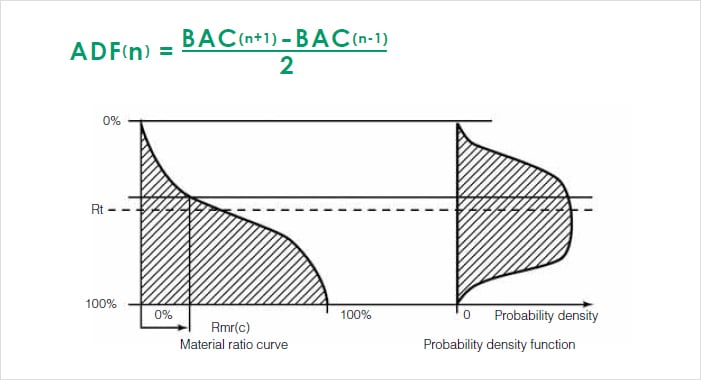
Probability density function (ADF)
ADF displays the probability of height Z(x) obtained across the evaluation length. The derivative of the BAC data is also determined. These derivatives use the three-point formula shown on the right.
When n=0 or N, calculations are carried out with BAC (-1) = 0.0 and BAC (N+1) = 100.0. Because the vertical range is the same as BAC, this is shown on the same graph. However, the graph is automatically adjusted so that the maximum value on the horizontal is 80%.

Surface Roughness Parameters
This section explains the main parameters of ISO 4287:1997. Each parameter is classified according to primary profile (P), roughness profile (R), and waviness profile (W) in order to evaluate different aspects of the profile. (When the wavelengths of the waviness and primary profile components are compared, the surface roughness component is the asperity component of that which has the comparatively shorter wavelength.)

Search from the parameters list
| Peaks and valleys in the height direction |
Arithmetical mean height (Ra, Pa, Wa) |
| Maximum height of profile (Rz, Pz, Wz) |
| Maximum profile peak height (Rp, Pp, Wp) |
| Maximum profile valley depth (Rv, Pv, Wv) |
| Mean height of profile elements (Rc, Pc, Wc) |
| Total height of profile (Rt, Pt, Wt) |
| Average amplitude in the height direction |
Root mean square deviation (Rq, Pq, Wq) |
| Average characteristics in the height direction |
Skewness (Rsk, Psk, Wsk) |
| Kurtosis (Rku, Pku, Wku) |
| Horizontal direction |
Mean width of the profile elements (RSm, PSm, WSm) |
| Hybrid |
Root mean square slope (R∆q, P∆q, W∆q) |
| Areal material ratio curve and probability density function |
Load length ratio (Rmr (c), Pmr (c), Wmr (c)) |
| Profile cut level difference (Rδc, Pδc, Wδc) |
| Relative load length ratio (Rmr, Pmr, Wmr) |
| Material ratio curve (BAC) |
| Probability density function (ADF) |

"What is line roughness?" page list

